

Staffing Levels - The Use of Resources to Achieve Educational, Research, and service Goals
These metrics enable Western Michigan University to evaluate whether the level of non-academic staff remains effective and efficient as the University provides educational, research, and public services.
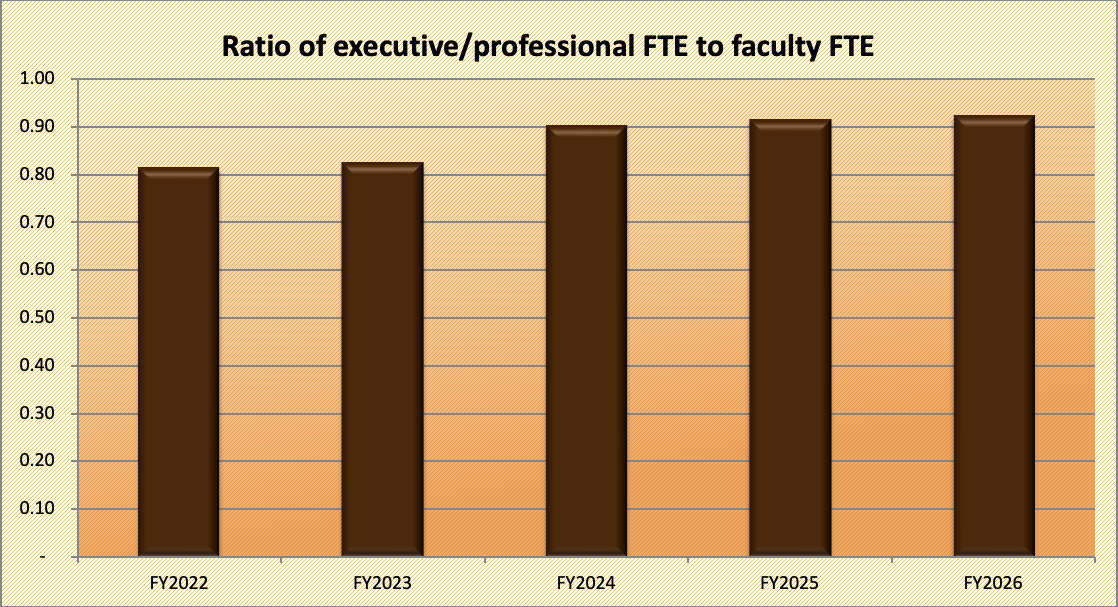
The ratio of executive and professional full-time employees to faculty full-time employees was 0.82 in fiscal year 2022, 0.83 in fiscal year 2023, 0.9 in fiscal year 2024, 0.92 in fiscal year 2025, and 0.93 in fiscal year 2026.
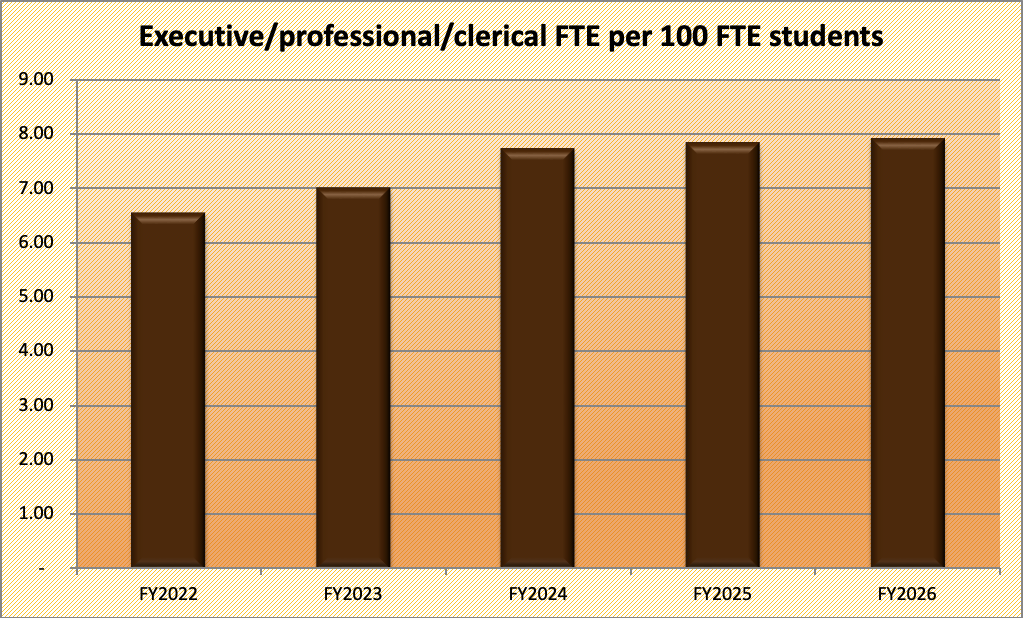
The executive, professional, and clerical full-time employees per one hundred full-time equivalent students was 6.54 for fiscal year 2022, 7 for fiscal year 2023, 7.73 for fiscal year 2024, 7.84 for fiscal year 2025, and 7.91 for fiscal year 2026.